The ESA Mediterranean Datacube brings together Earth observation and ocean science datasets for the Mediterranean Sea as part of EarthCODE’s work to make data easier to access and analyse. Drawing on ESA Ocean Science Cluster activities and complementary research products, it covers ocean circulation, physical and biogeochemical conditions, marine productivity, carbon exchange and marine heatwaves.
The datasets share a common 1/24° latitude-longitude grid in EPSG:4326 and are organised in analysis-ready GeoZarr format, with separate stores for monthly variables, daily surface and depth-resolved fields, and hourly currents.
Visit the ocean hackathon website to explore the data and accompanying examples, or browse the notebooks on GitHub.
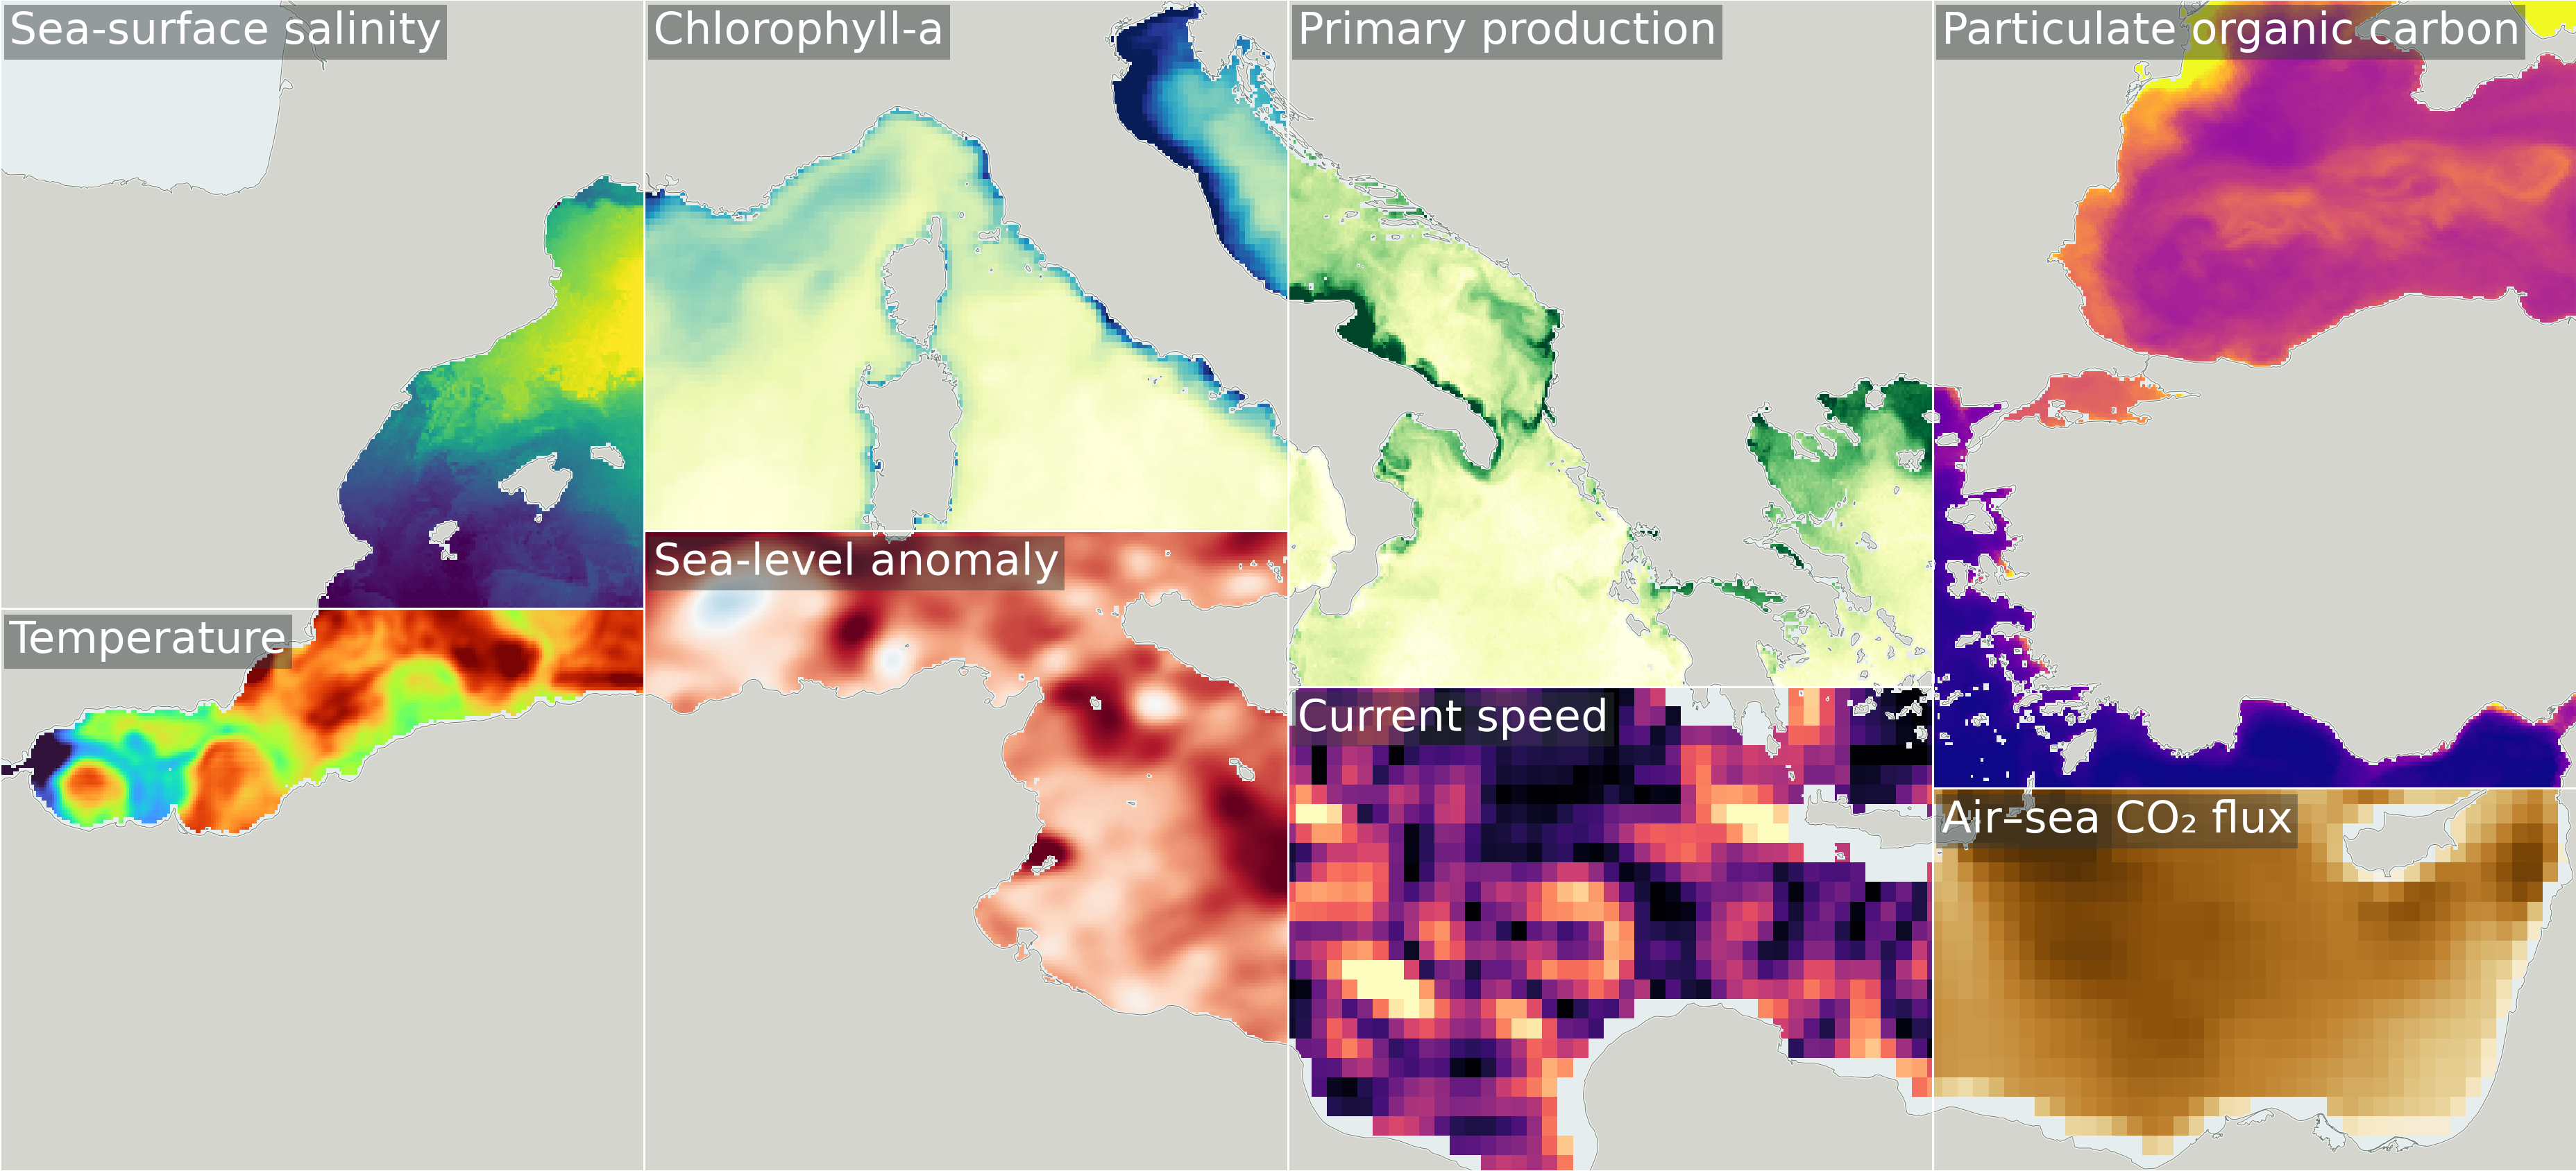
Example variables from the ESA Mediterranean Datacube.
The Data
The collection covers the Mediterranean Sea, approximately 6°W-36°E and 30°N-46°N. The daily and monthly grids cover 2016-2022, with depth-resolved data through July 2022; hourly currents cover late 2014-2019. Availability varies by source dataset and variable.
Daily Surface Variables
The daily surface datasets we have processed are:
- 4DMED-SEA Surface Salinity and Density: sea-surface salinity, density and associated uncertainties.
- Original Data Source: Zenodo dataset
- Open Science Catalog: 4DMED-2D SSS
- 4DMED-SEA Ocean Stirring: finite-size Lyapunov exponents describing the separation of nearby water parcels.
- Original Data Source: Zenodo dataset
- Open Science Catalog: 4DMED-2D ALT MIOST LE
- 4DMED-SEA Sea Level and Geostrophic Currents: sea-level anomaly, absolute dynamic topography, geostrophic velocities and relative vorticity from the 4DvarNET products.
- Original Data Sources: 1/8° product, 1/20° product
- Reference: 4DVarNet study
- Open Science Catalog: 1/8° product, 1/20° product
- CAREHeat Marine Heatwaves: marine heatwave categories from the original and detrended sea-surface temperature records.
- Original Data Source: CAREHeat data at Ifremer
- Reference: Ifremer dataset record
- Open Science Catalog: CAREHeat database
Monthly Ocean Variables
The monthly store includes:
- 4DMED-SEA Phytoplankton and Underwater Light: phytoplankton functional types and diffuse attenuation coefficients.
- Original Data Source: Zenodo dataset
- Open Science Catalog: 4DMED-2D PFT and Kd
- Ocean Heat Content: ocean heat-content change from satellite-based estimates.
- Original Data Source: AVISO ocean heat-content product
- Reference: Product documentation
- Open Science Catalog: 4D Atlantic ocean heat content
- OceanSODA: surface carbonate chemistry, including pH, dissolved inorganic carbon, alkalinity and carbonate saturation, together with air-sea CO₂ fluxes and related variables.
- Original Data Source: OceanSODA dataset record
- Open Science Catalog: OceanSODA-ETHZ
- BICEP: marine primary productivity, export production, particulate organic carbon, phytoplankton carbon and chlorophyll-a.
- Original Data Source: BICEP data at CEDA
- Reference: BICEP project deliverables
- Open Science Catalog: BICEP database
- MITHO Cumulative Hazard Indices: cumulative hazard indices and their contributing stressors, supporting analysis of multiple threats to ocean health.
- Original Data Source: Zenodo dataset
- Open Science Catalog: Global cumulative hazard indices
Daily Depth-Resolved Variables
The depth-resolved store includes fields at 18 levels from 3 to 135 m:
- 4DMED-SEA Subsurface Physical Fields: temperature, salinity, geostrophic currents and mixed-layer depth.
- Original Data Source: Zenodo dataset
- Open Science Catalog: 4DMED temperature, salinity and geostrophic currents
- 4DMED-SEA Primary Production: depth-resolved primary production and euphotic-zone depth.
- Original Data Source: 4DMED primary-production data
- Open Science Catalog: 4DMED-3D primary production
Hourly Currents
- World Ocean Circulation (WOC) Total Currents at 15 m: hourly total currents, with geostrophic and wind-driven components.
- Original Data Source: WOC product record
- Open Science Catalog: Total surface current at 15 m
Each source dataset retains its own attribution, licence and scientific reference. See the dataset overview and access examples for more information.
Access
- Monthly variables: ocean-med-monthly-cube.zarr
- Daily surface variables: ocean-med-daily-surface-cube.zarr
- Daily depth-resolved variables: ocean-med-biophysics.zarr
- Hourly currents: hourly_cube.zarr
Reading the Data
You can read the monthly GeoZarr store using Xarray, opening group 0 for the full-resolution grid:
import xarray as xr

ds = xr.open_zarr("https://s3.waw4-1.cloudferro.com/EarthCODE/OSCAssets/med_cubes/ocean-med-monthly-cube.zarr", group="0", chunks={})
ds
The store also provides groups 1 and 2 for coarser spatial levels. For example, you can open group 1 and select chlorophyll-a for July 2019:
coarse_ds = xr.open_zarr("https://s3.waw4-1.cloudferro.com/EarthCODE/OSCAssets/med_cubes/ocean-med-monthly-cube.zarr", group="1", chunks={})

chlorophyll = coarse_ds["chl_a"].sel(time="2019-07-01")
chlorophyll
The stores share a spatial grid, but their time coordinates and depth dimensions differ. Select the variables and align the time periods needed for your analysis when working across stores.
For tutorials and worked examples, visit the Mediterranean Datacube getting-started notebook or GitHub repository.
To suggest a dataset, share a use case or help extend the collection, reply here or email earth-code@esa.int.